
Stop Managing Yesterday's Data. Get Real-Time Visibility Into Customer Experience Performance.
Feebak BI transforms raw customer feedback and interaction data into live, actionable intelligence. Contact center managers, CX teams, and executives get the dashboards and reports they need — customized for their role, updated in real time, delivered automatically.
85% - Reduction in manual reporting time
Real-Time - Dashboard refresh rate
10+ Role-specific dashboard templates
Zero - Coding required
Trusted by 150+ Companies





The Reporting Problem
Weekly Reports Don't Catch Monday's Crisis by Wednesday.
Most contact center analytics workflows look the same: agents export spreadsheets, analysts merge files, managers paste numbers into slides, and leadership reviews data that's already 5-7 days old. By the time anyone notices a sentiment drop, hundreds more customers have had the same negative experience.
The Reporting Problem
Weekly Reports Don't Catch Monday's Crisis by Wednesday.
Most contact center analytics workflows look the same: agents export spreadsheets, analysts merge files, managers paste numbers into slides, and leadership reviews data that's already 5-7 days old. By the time anyone notices a sentiment drop, hundreds more customers have had the same negative experience.
The Reporting Problem
Weekly Reports Don't Catch Monday's Crisis by Wednesday.
Most contact center analytics workflows look the same: agents export spreadsheets, analysts merge files, managers paste numbers into slides, and leadership reviews data that's already 5-7 days old. By the time anyone notices a sentiment drop, hundreds more customers have had the same negative experience.

Delayed Visibility
Traditional reporting cycles mean issues discovered in Friday's meeting have been affecting customers since Monday. Every day of delay compounds the damage to satisfaction scores and customer loyalty.
Delayed Visibility
Traditional reporting cycles mean issues discovered in Friday's meeting have been affecting customers since Monday. Every day of delay compounds the damage to satisfaction scores and customer loyalty.
Delayed Visibility
Traditional reporting cycles mean issues discovered in Friday's meeting have been affecting customers since Monday. Every day of delay compounds the damage to satisfaction scores and customer loyalty.

Disconnected Data
Feedback lives in one system. Interaction data lives in another. Queue performance lives in a third. Manually merging these sources is slow, error-prone, and unsustainable at scale.
Disconnected Data
Actionable suggestions from your data, without digging into spreadsheets .
Disconnected Data
Feedback lives in one system. Interaction data lives in another. Queue performance lives in a third. Manually merging these sources is slow, error-prone, and unsustainable at scale.

One-Size-Fits-All
A single dashboard built for managers doesn't serve executives who need high-level trends, or agents who need personal performance metrics. Generic reporting creates noise, not clarity.
One-Size-Fits-All
Actionable suggestions from your data, without digging into spreadsheets .
One-Size-Fits-All
A single dashboard built for managers doesn't serve executives who need high-level trends, or agents who need personal performance metrics. Generic reporting creates noise, not clarity.

Live Dashboards
Know What's Happening in Your Contact Center Right Now
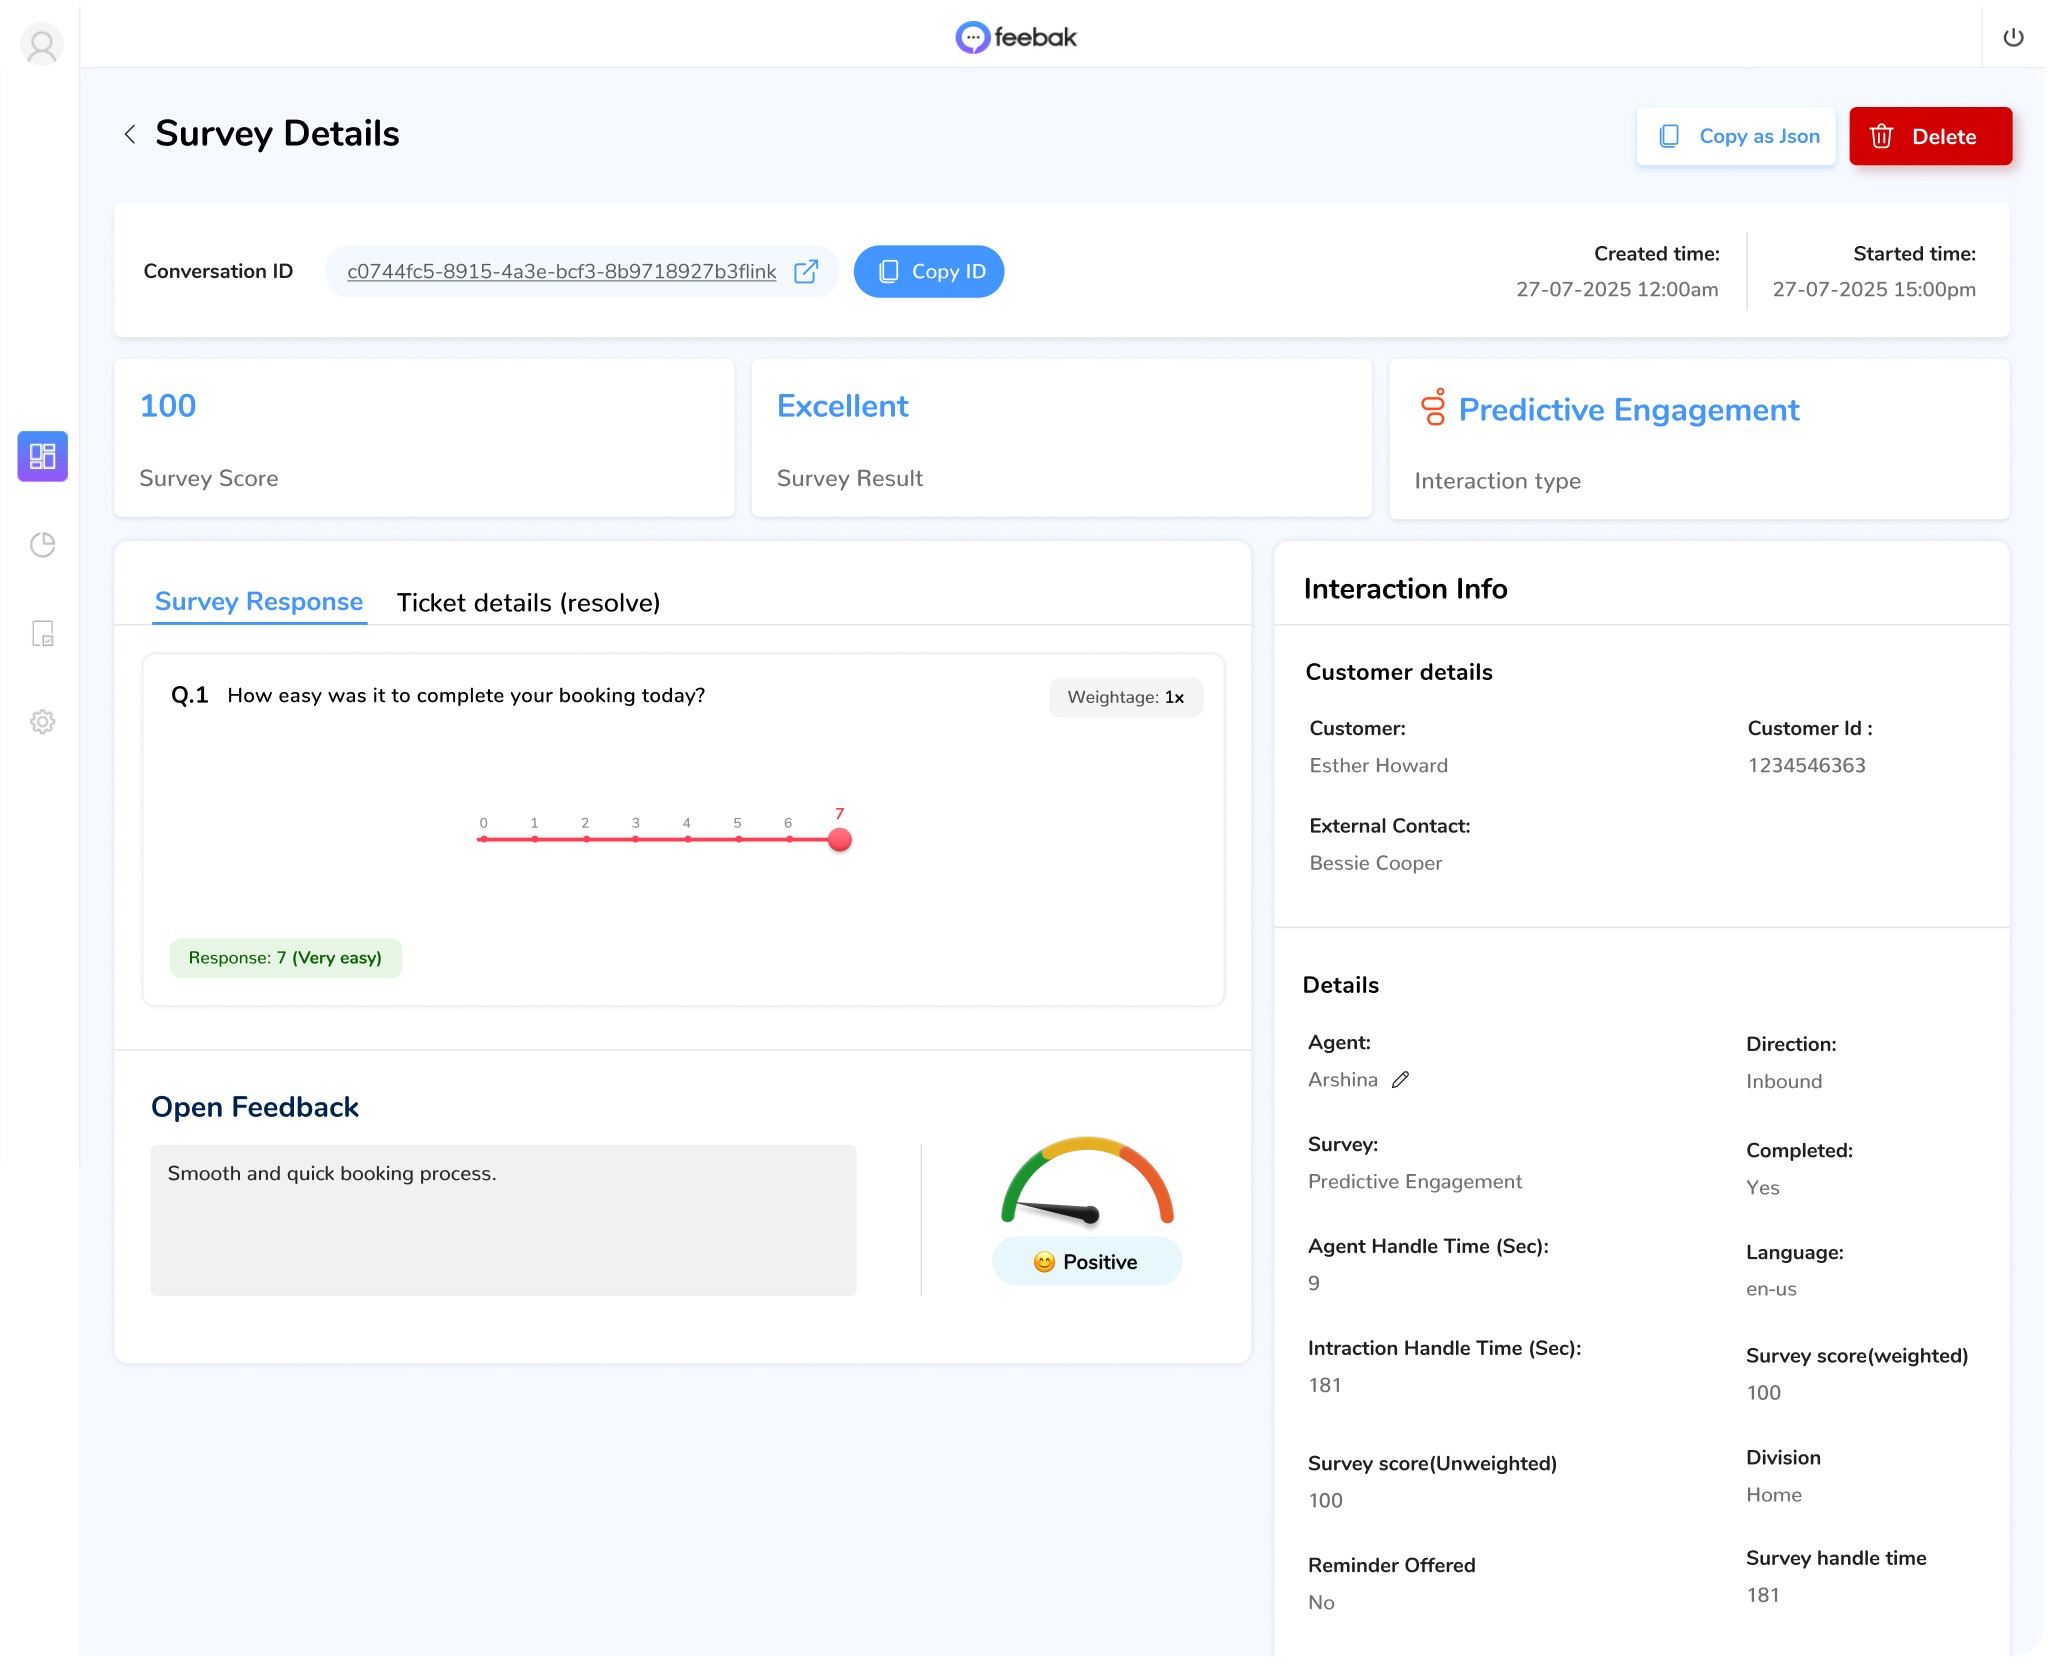
Feebak BI streams live data from surveys, AI interaction analysis, and Genesys Cloud operations into customizable dashboards that update continuously — no manual refresh, no export, no waiting. Your operations team always has an accurate picture of what's happening, across every channel and queue simultaneously.
Live CSAT, NPS, updating with every new response
Real-time sentiment trend monitoring with threshold-based anomaly alerts
Live queue performance — response rates, abandonment, completion by channel
Agent and team-level satisfaction visibility in real time
Division and department performance comparison dashboards
Operational health scores combining multiple CX metrics into single indicators
Instant drill-down from organization-wide overview to individual interaction level
"When CSAT drops below your threshold, Feebak BI flags it instantly — not in next week's report"
Live Dashboards
Know What's Happening in Your Contact Center Right Now
Feebak BI streams live data from surveys, AI interaction analysis, and Genesys Cloud operations into customizable dashboards that update continuously — no manual refresh, no export, no waiting. Your operations team always has an accurate picture of what's happening, across every channel and queue simultaneously.
Live CSAT, NPS, updating with every new response
Real-time sentiment trend monitoring with threshold-based anomaly alerts
Live queue performance — response rates, abandonment, completion by channel
Agent and team-level satisfaction visibility in real time
Division and department performance comparison dashboards
Operational health scores combining multiple CX metrics into single indicators
Instant drill-down from organization-wide overview to individual interaction level
"When CSAT drops below your threshold, Feebak BI flags it instantly — not in next week's report"
Role-Based Dashboards
More responses. Better signal. Less noise.
Different roles require radically different levels of visibility. A contact center supervisor monitoring live queue performance needs completely different data than a CFO reviewing quarterly NPS trends. Feebak BI provides purpose-built dashboard templates for every role in the organization — deployed instantly, customized easily.
Role-Based Dashboards
More responses. Better signal. Less noise.
Different roles require radically different levels of visibility. A contact center supervisor monitoring live queue performance needs completely different data than a CFO reviewing quarterly NPS trends. Feebak BI provides purpose-built dashboard templates for every role in the organization — deployed instantly, customized easily.
Role-Based Dashboards
More responses. Better signal. Less noise.
Different roles require radically different levels of visibility. A contact center supervisor monitoring live queue performance needs completely different data than a CFO reviewing quarterly NPS trends. Feebak BI provides purpose-built dashboard templates for every role in the organization — deployed instantly, customized easily.

Contact Center Managers
Full operational visibility: live queue performance, agent satisfaction ratings, survey completion rates, escalation trends, and SLA adherence. The complete picture to run the floor effectively.
Contact Center Managers
Full operational visibility: live queue performance, agent satisfaction ratings, survey completion rates, escalation trends, and SLA adherence. The complete picture to run the floor effectively.
Contact Center Managers
Full operational visibility: live queue performance, agent satisfaction ratings, survey completion rates, escalation trends, and SLA adherence. The complete picture to run the floor effectively.

CX Analysts
Deep segmentation, cohort analysis, trend visualization, and root-cause investigation tools. Advanced filtering to isolate exactly which customer segments, channels, or interaction types are driving satisfaction changes.
CX Analysts
Actionable suggestions from your data, without digging into spreadsheets .
CX Analysts
Deep segmentation, cohort analysis, trend visualization, and root-cause investigation tools. Advanced filtering to isolate exactly which customer segments, channels, or interaction types are driving satisfaction changes.

Supervisors
Team-level performance monitoring, agent coaching insights, real-time low-satisfaction alerts, and case workload visibility — designed for the person responsible for daily team outcomes.
Supervisors
Team-level performance monitoring, agent coaching insights, real-time low-satisfaction alerts, and case workload visibility — designed for the person responsible for daily team outcomes.
Supervisors
Team-level performance monitoring, agent coaching insights, real-time low-satisfaction alerts, and case workload visibility — designed for the person responsible for daily team outcomes.

Executives & Leadership
High-level KPI summaries, trend lines, competitive benchmarking views, and board-ready report generation. Weekly and monthly executive summaries delivered automatically on schedule.
Executives & Leadership
High-level KPI summaries, trend lines, competitive benchmarking views, and board-ready report generation. Weekly and monthly executive summaries delivered automatically on schedule.
Executives & Leadership
High-level KPI summaries, trend lines, competitive benchmarking views, and board-ready report generation. Weekly and monthly executive summaries delivered automatically on schedule.
Division & Branch Managers
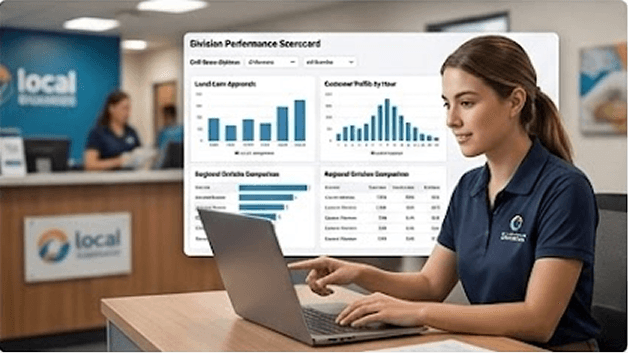
Scoped visibility to their own division's performance. Regional comparison, branch-level CSAT trends, and division-specific drill-down without access to other business units' data.
Division & Branch Managers
Scoped visibility to their own division's performance. Regional comparison, branch-level CSAT trends, and division-specific drill-down without access to other business units' data.
Division & Branch Managers
Scoped visibility to their own division's performance. Regional comparison, branch-level CSAT trends, and division-specific drill-down without access to other business units' data.

Operations Teams
Operational efficiency metrics: resolution times, callback rates, escalation volumes, case aging reports, and workflow performance analytics across teams and processes.
Operations Teams
Operational efficiency metrics: resolution times, callback rates, escalation volumes, case aging reports, and workflow performance analytics across teams and processes.
Operations Teams
Operational efficiency metrics: resolution times, callback rates, escalation volumes, case aging reports, and workflow performance analytics across teams and processes.
The Complete Set of Customer Experience Metrics That Enterprise Organizations Track
Feebak BI tracks every standard CX metric your leadership team reports — plus the operational and diagnostic metrics your operations teams need to improve performance at the process level.
Custom KPI tracking
Unlimited projects
Unlimited clients
Time tracking
CRM
iOS & Andriod app
Your KPIs
Any custom metric your business tracks
The Complete Set of Customer Experience Metrics That Enterprise Organizations Track
Feebak BI tracks every standard CX metric your leadership team reports — plus the operational and diagnostic metrics your operations teams need to improve performance at the process level.
Custom KPI tracking
Unlimited projects
Unlimited clients
Time tracking
CRM
iOS & Andriod app
Your KPIs
Any custom metric your business tracks
Segmentation
Find the Exact Answer You're Looking For in Seconds
When satisfaction drops, the critical question isn't just what dropped — it's where, when, for whom, and why. Feebak BI's multi-dimensional filtering lets you drill into any combination of variables instantly to isolate the exact source of a performance change.
Segmentation
Find the Exact Answer You're Looking For in Seconds
When satisfaction drops, the critical question isn't just what dropped — it's where, when, for whom, and why. Feebak BI's multi-dimensional filtering lets you drill into any combination of variables instantly to isolate the exact source of a performance change.
Segmentation
Find the Exact Answer You're Looking For in Seconds
When satisfaction drops, the critical question isn't just what dropped — it's where, when, for whom, and why. Feebak BI's multi-dimensional filtering lets you drill into any combination of variables instantly to isolate the exact source of a performance change.

Interaction Dimensions
Channel (voice, chat, email, WhatsApp, web, kiosk)
Queue and skill group
Agent and team
Division and business unit
Interaction outcome (resolved, transferred, escalated, abandoned)
Time of day, day of week, date range

Customer Dimensions:
Customer segment (VIP, standard, at-risk)
Customer tenure and lifetime value-
Product or service type-
Geographic region and language-
Survey type (CSAT, NPS, CES, custom)
Sentiment score range
Bring Customer Experience Data Into the Analytics Tools Your Teams Already Use
Your analysts shouldn't have to learn a new tool. Feebak BI connects to the BI platforms your organization already uses — pushing customer experience data into the environments where your teams do their best analytical work.
Custom KPI tracking
Unlimited projects
Unlimited clients
Time tracking
CRM
iOS & Andriod app
Your KPIs
Any custom metric your business tracks
Bring Customer Experience Data Into the Analytics Tools Your Teams Already Use
Your analysts shouldn't have to learn a new tool. Feebak BI connects to the BI platforms your organization already uses — pushing customer experience data into the environments where your teams do their best analytical work.
Custom KPI tracking
Unlimited projects
Unlimited clients
Time tracking
CRM
iOS & Andriod app
Your KPIs
Any custom metric your business tracks
Automated Reporting
The Right Report Reaches the Right Person Automatically — Before They Ask For It
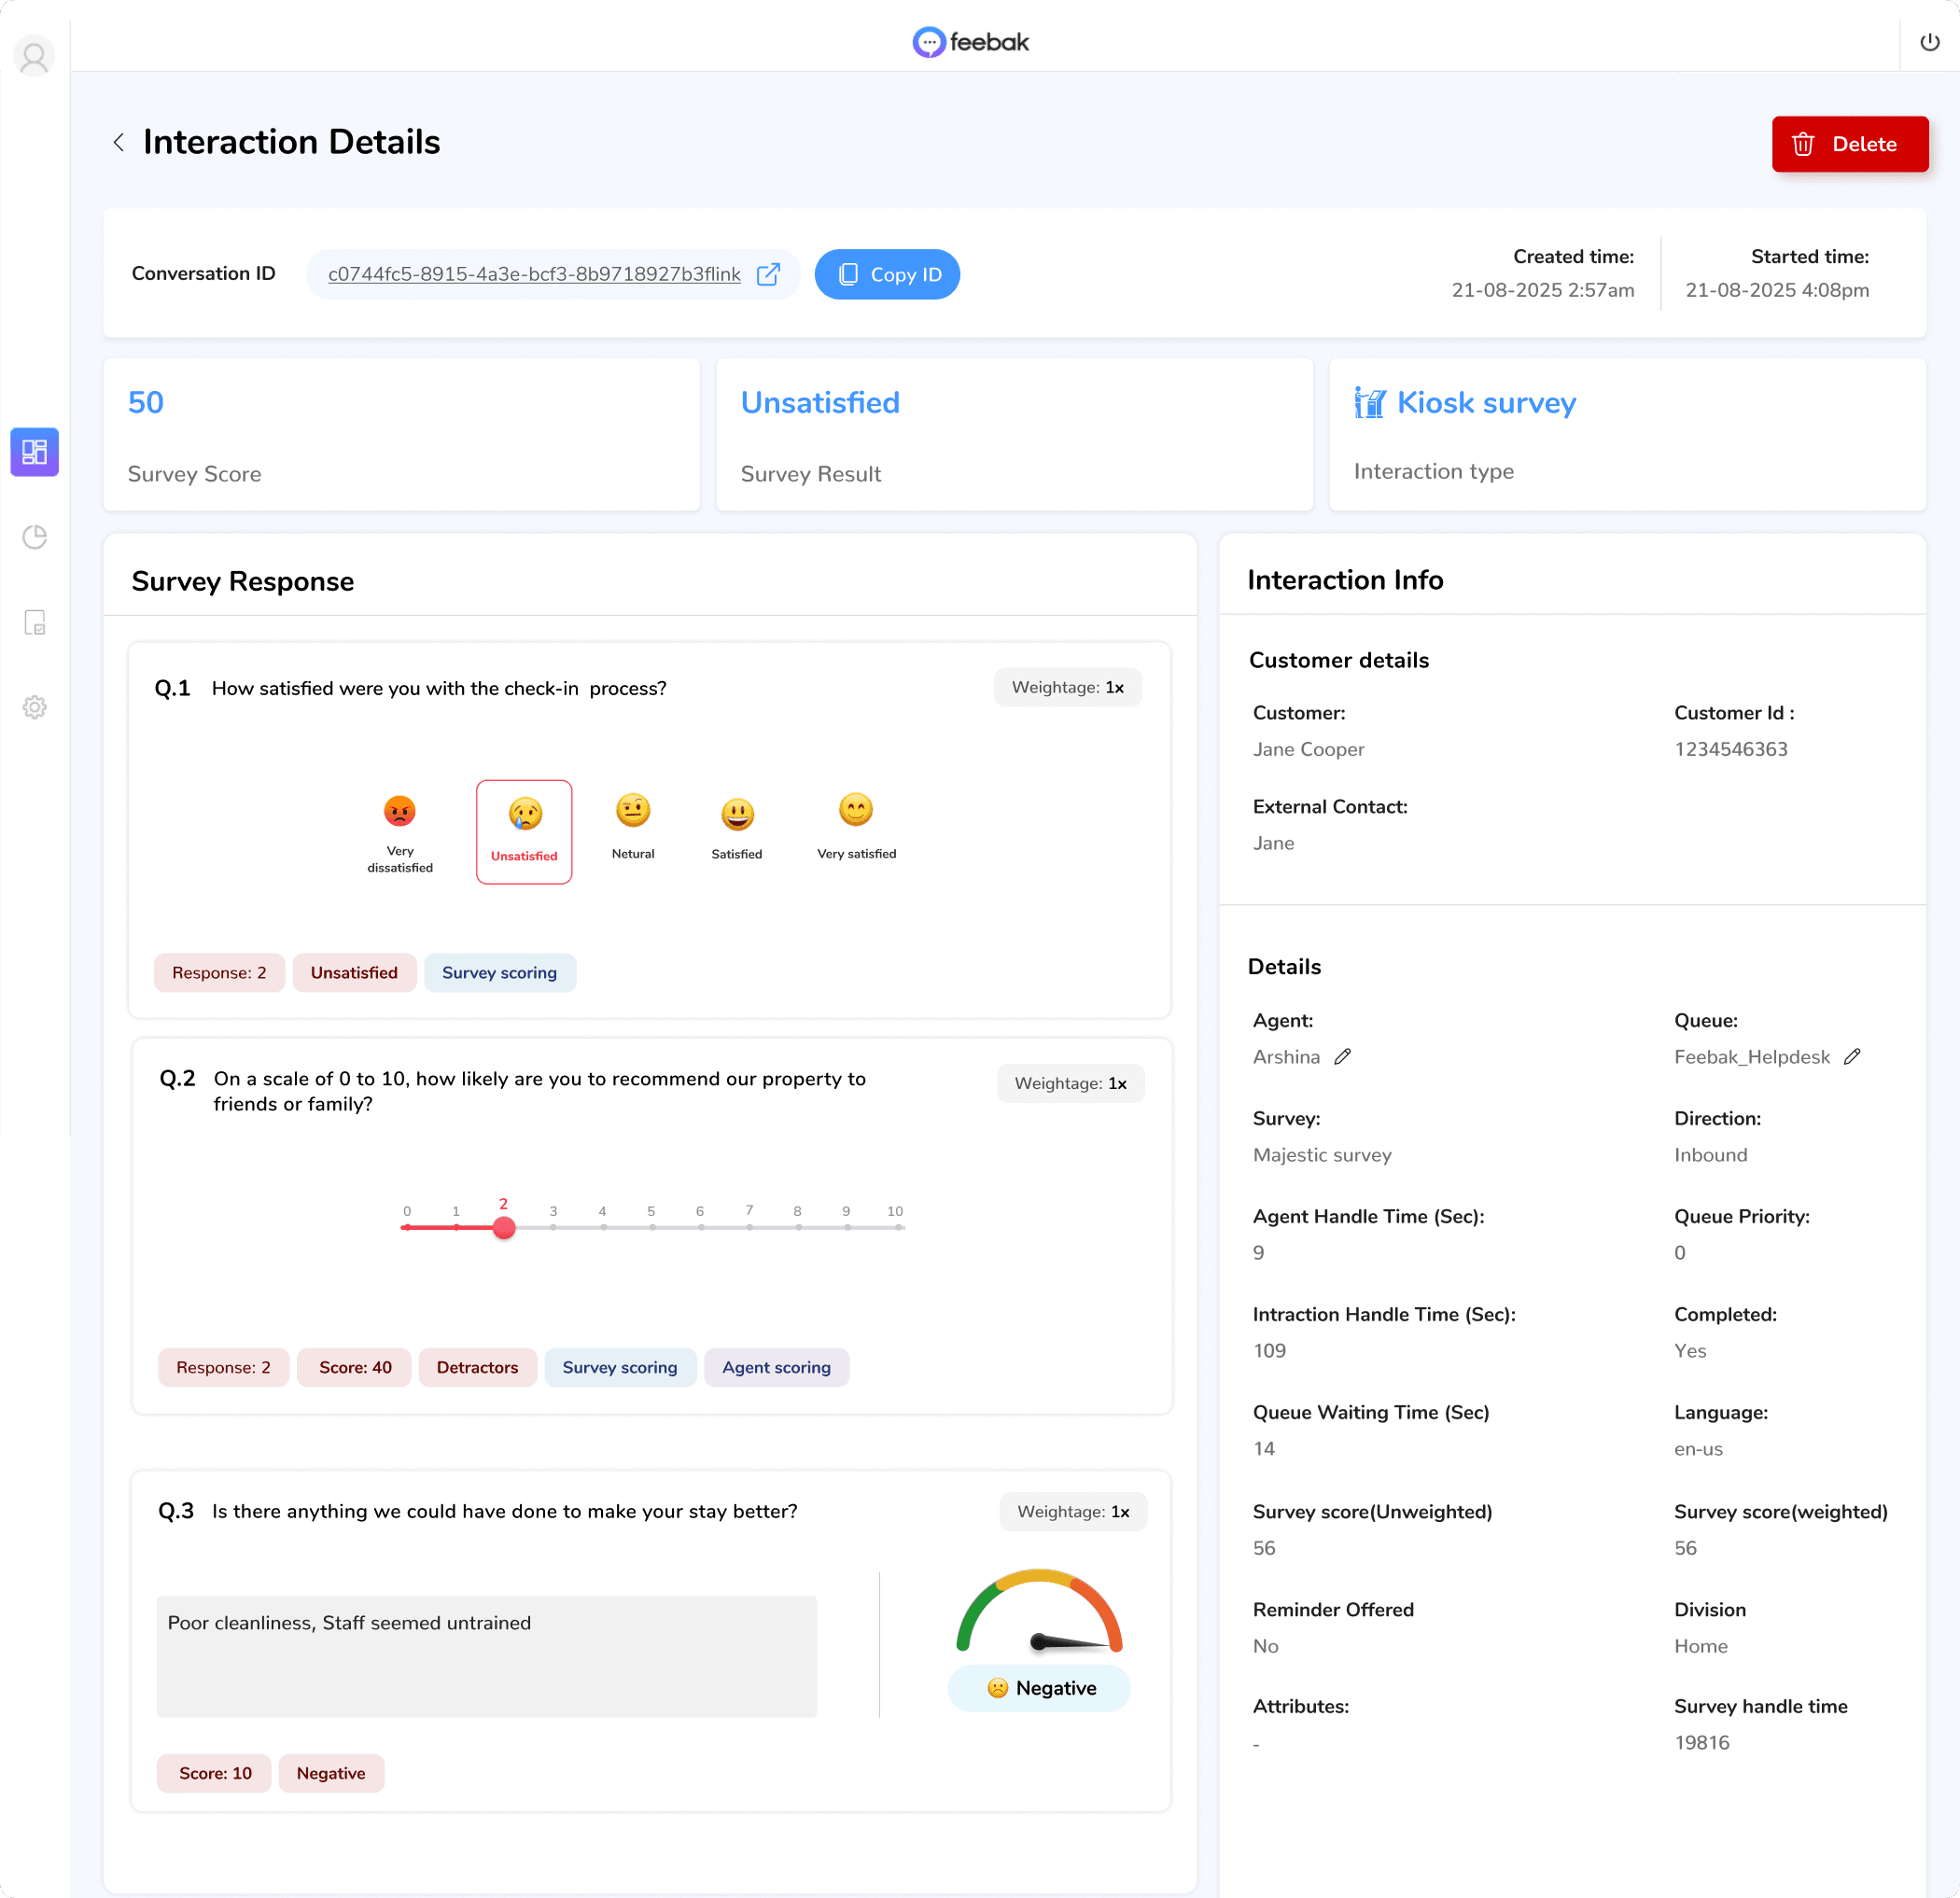
Scheduled Distribution — Daily, weekly, and monthly reports sent automatically to configured recipientsReal-time sentiment trend monitoring with threshold-based anomaly alerts
Role-Filtered Reports — Each recipient receives only the data relevant to their scope and responsibilities
Role-Filtered Reports — Each recipient receives only the data relevant to their scope and responsibilitiesRole-Filtered Reports — Each recipient receives only the data relevant to their scope and responsibilities
Excel & PDF Export — One-click export in formats leadership teams already use
Dashboard Sharing — Share live dashboard links with stakeholders who don't need full platform access
Alert-Based Reports — Trigger ad-hoc reports automatically when metrics cross defined thresholds
API-Driven Reporting — Pull any Feebak BI data programmatically into your existing BI stack
BI Integrations — Native connectors for Tableau, Power BI, Looker, Google Data Studio, and more
Automated Reporting
The Right Report Reaches the Right Person Automatically — Before They Ask For It
Scheduled Distribution — Daily, weekly, and monthly reports sent automatically to configured recipientsReal-time sentiment trend monitoring with threshold-based anomaly alerts
Role-Filtered Reports — Each recipient receives only the data relevant to their scope and responsibilities
Role-Filtered Reports — Each recipient receives only the data relevant to their scope and responsibilitiesRole-Filtered Reports — Each recipient receives only the data relevant to their scope and responsibilities
Excel & PDF Export — One-click export in formats leadership teams already use
Dashboard Sharing — Share live dashboard links with stakeholders who don't need full platform access
Alert-Based Reports — Trigger ad-hoc reports automatically when metrics cross defined thresholds
API-Driven Reporting — Pull any Feebak BI data programmatically into your existing BI stack
BI Integrations — Native connectors for Tableau, Power BI, Looker, Google Data Studio, and more
FAQ's
Common questions with Clear answers
Here are answers to the most common things people ask before getting started.
FAQ's
Common questions with Clear answers
Here are answers to the most common things people ask before getting started.
FAQ's
Common questions with Clear answers
Here are answers to the most common things people ask before getting started.
Can I create custom dashboards beyond the templates?
Yes. While Feebak is purpose-built for Genesys Cloud, surveys can be triggered via API from any system, or deployed through email and web channels independently.
How often do dashboards refresh?
Can different users see different data?
Is historical data available from day one?
Can I create custom dashboards beyond the templates?
Yes. While Feebak is purpose-built for Genesys Cloud, surveys can be triggered via API from any system, or deployed through email and web channels independently.
How often do dashboards refresh?
Can different users see different data?
Is historical data available from day one?
Ready to See Your Customer Experience Data in Real Time?
Book a demo and see how Feebak BI turns disconnected feedback and interaction data into live intelligence that helps your team act faster, report smarter, and improve continuously.